

Customer experience / Product design
Xpert Maps.
A working map of what customers do, what the business does and where the experience can improve.
- My role
- Product direction, journey structure, interface design and development
- Project
- In-house digital product
01 / THE BRIEF
Make the customer journey a working tool.
A customer journey has to connect the outside view with the work happening inside the business. It should show what a customer is trying to do, who supports that moment and where a better experience might be possible. Xpert Journeys makes that relationship visible across different routes to market. B2B, direct-to-consumer and in-store journeys can each have their own stages and content, while sharing a consistent structure. The aim was a map the team could keep working on, with enough control to protect the core journey while inviting new ideas.

02 / THE IDEA
Put the customer and the business side by side.
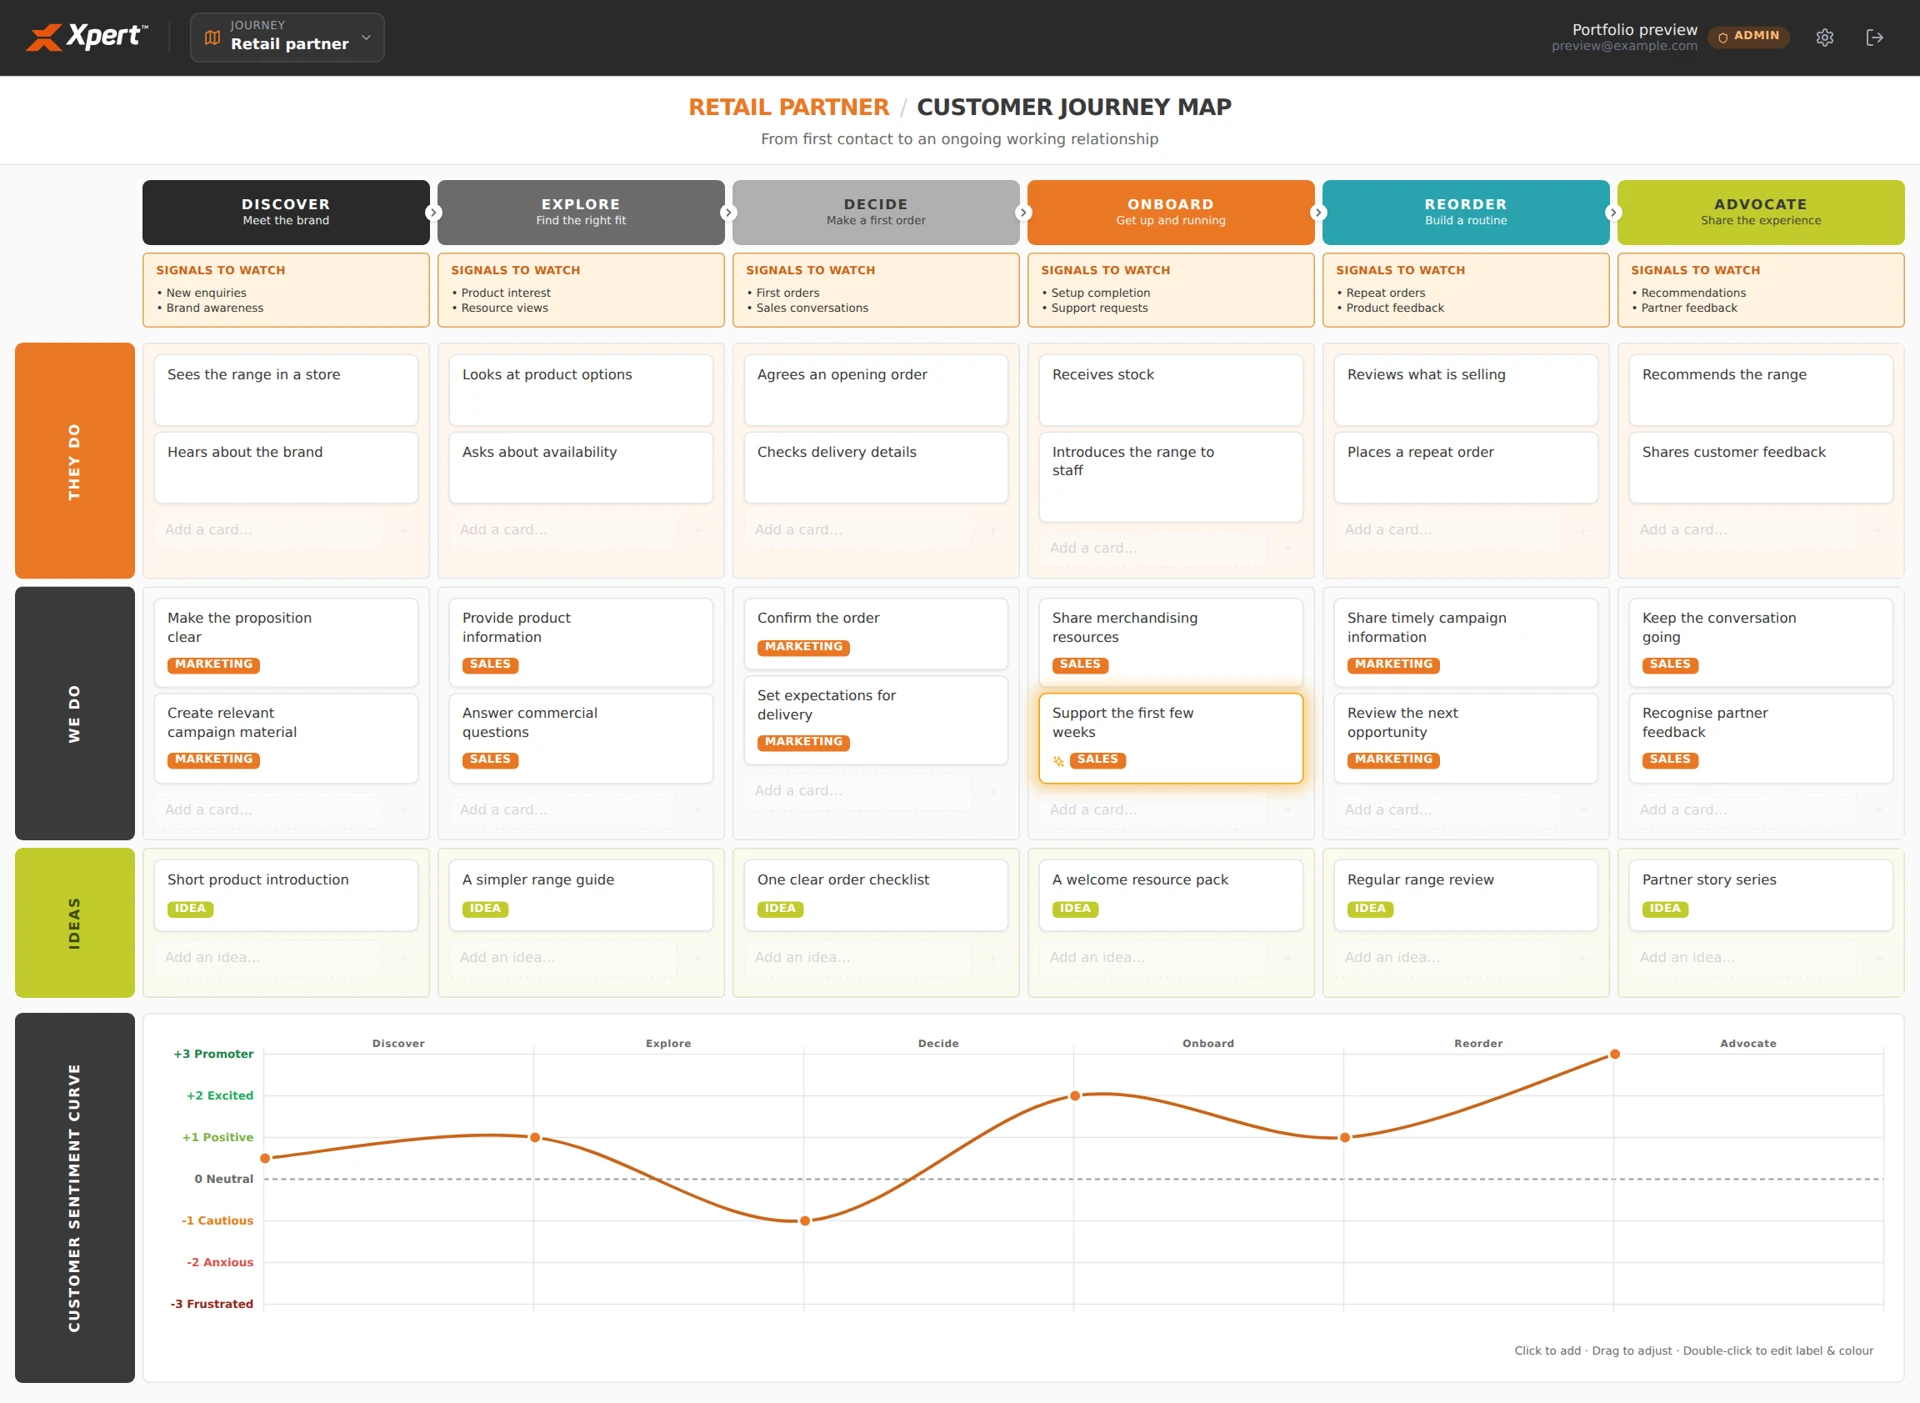
Use a simple question as the organising principle: what is happening for the customer at this stage, and what are we doing about it? Each stage aligns three rows — They do, We do and Ideas — so customer behaviour, business activity and opportunities can be read together. Department tags make responsibility visible. A KPI strip adds the signals worth watching, while a sentiment curve draws attention to moments of confidence or friction. Keeping those layers together makes the journey a discussion tool as well as a record.
03 / THE BUILD
A map the team can work on together.
The board is built as a sequence of editable stages with draggable cards. Administrators can shape the journey, change stage labels and colours, maintain KPIs, edit sentiment points and attach supporting material. Cards carry department or idea-status tags, and selected moments can be marked for emphasis. The sentiment curve runs beneath the same stages, keeping the emotional reading tied to the practical steps above it. A journey switcher supports multiple customer routes, with active, coming-soon and draft states controlling visibility. Editors can contribute and manage their own ideas without being able to rewrite the whole map; viewers can explore the published journeys and attachments. The application also includes user management, persistent data and realtime updates.
04 / THE SCOPE
What went into it.
- 01
A shared journey language
Structured the board around stages and three connected rows: customer actions, business actions and ideas. Each journey can be tailored without losing the common way of reading it.
- 02
A board built to change
Implemented editable stage information, card creation and drag-and-drop movement. The map can evolve as the team discusses the experience rather than requiring a new static diagram for every change.
- 03
The experience beneath the actions
Built an editable customer sentiment curve aligned to the journey stages, with a seven-level emotional scale. KPI strips and start/end states add another layer of context to the map.
- 04
Ideas with ownership
Added department tags for business activity, status tags for ideas and role-aware editing. Editors can work on their own ideas while administrators retain control of the core journey structure.
- 05
Evidence alongside the map
Supported file attachments, web links and SharePoint references on cards. Relevant material can stay attached to the touchpoint it explains, instead of living in a disconnected document list.
- 06
A maintained internal product
Built journey publication states, account administration, database permissions, storage and realtime updates. Multiple journey types share one system while keeping their stages and working content distinct.
05 / THE RESULT
Where it stands.
The delivered application turns the journey map into a maintained workspace: multiple journeys, editable boards, sentiment curves, supporting evidence and controlled participation. It gives the team a consistent way to place customer behaviour beside the work that supports it. The portfolio screens show the real interface populated with sample content; they do not expose Xpert’s internal journey detail.
In-house product
Talk about a similar project